

The problems with net promoter scores: how to better measure customer advocacy
Share
Dr Dave Stewart of Marketing Decision Analysis and Prof Steve Worthington of Swinburne University Business School critique the usefulness and relevance of the net promoter score (NPS) and suggest questions all companies who use this metric should be asking.
Organisations in many industries are facing challenges from the so-called ‘disruptors’, whose different business models enable them to attract customers from the traditional product providers and then to keep those customers. Examples include Airbnb in accommodation, Uber in the taxi business, SocietyOne in peer-to-peer lending, and Apple Pay in the payments world.
Financial services providers face the challenge of how to keep their existing customers and to use their customer’s goodwill towards their current provider, to then encourage them to become advocates for their business, so as to attract new customers. Many organisations have used a customer advocacy metric called the net promoter score (NPS) to assess the extent to which their customers are either Promoters or Detractors for their business. The NPS calculation is based on a single advocacy question that can be put to customers. Managers are attracted to the NPS because of its simplicity, and ability to track advocacy over time.
The origin of NPS
For much of the 1990s and through until the early 2000s, management was intent on improving customer satisfaction, using metrics such as ‘average satisfaction’, ‘relative satisfaction’, and ‘percentage very satisfied’. Then in a 2003 Harvard Business Review article, Fred Reichheld of Bain & Company introduced the NPS. This was followed soon after by his 2006 book, The Ultimate Question, in which he launched a scathing attack on the satisfaction orthodoxy, proclaiming the advocacy question to be its rightful successor, and the NPS as “one number you need to grow”. Despite the fact that his claims of NPS’ superiority have since been questioned by marketing academics, it would seem that management was ready for a new ‘silver bullet’, resulting in the NPS now being the standard customer metric across numerous organisations.
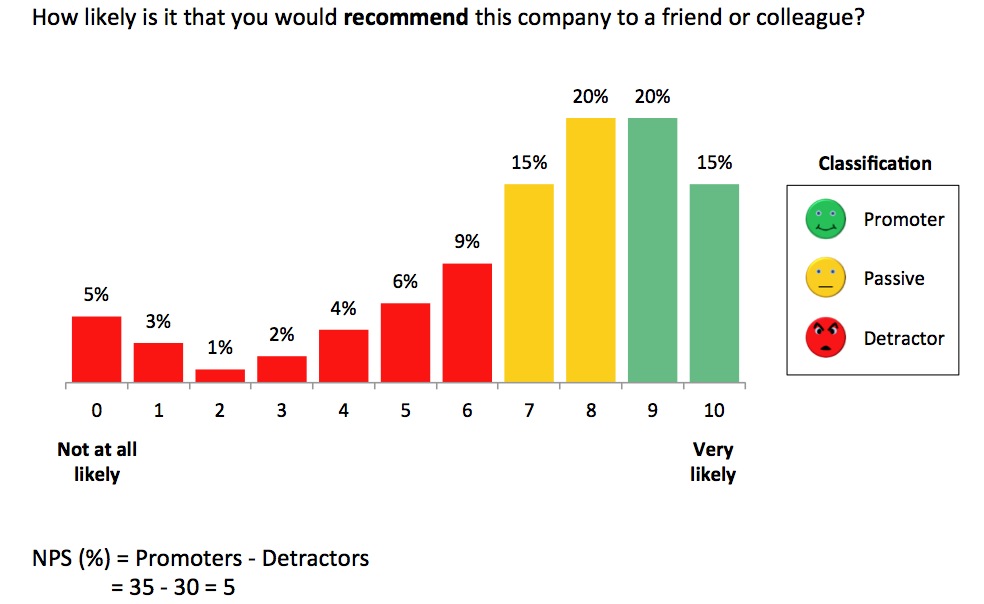
The NPS calculation is a trademarked term owned jointly by Reichheld and two other parties. Underpinning the calculation is his claim that a customer’s answer to the advocacy question can be used to reliably classify them as either promoters (loyal enthusiasts who keep buying from a company and urge their friends to do the same), detractors (unhappy customers trapped in a bad relationship), or passives (satisfied but unenthusiastic customers who are easily wooed by the competition). The NPS calculation is then a simple netting of his so-called promoters and detractors.
Click images to enlarge.
NPS weaknesses and blind spots
The most obvious weakness of the NPS is its classification bias. This occurs when customers are systematically misallocated to the wrong advocacy state. Because bias is systematic, it cannot be ‘averaged out’ or reduced by interviewing more customers. So whether Telstra, for example, calculates its NPS from the daily responses of four customers or 40,000 customers, the bias is exactly the same.
The cause of misclassification is simply that too much is expected of the advocacy question. While responses to the question can provide information as to whether customers are more or less likely to promote a company, they do not provide the necessary information for determining the actual numbers of detractors and passives. This should come as no surprise as the question only concerns positive recommendations. This is a perfect example of where the saying ‘if it sounds too good to be true, then it probably is’ applies.
Reichheld describes his classification rules as a ‘fundamental perspective’, but ‘fundamentally flawed’ would be more apt. The consequences for an organisation that uses the NPS as its KPI for organisational performance can be costly, as the metric most probably has a negative bias; that is, it overestimates the true number of detractors and under-estimates the true number of promoters. This is likely to result in organisations allocating more resources than necessary to address an issue with customer advocacy which, in reality, may not exist, or is not as serious as the NPS suggests.
Another structural weakness in the NPS lies with two assumptions implicit in its calculation.
First, the positive value of a promoter to the organisation is exactly offset by the negative value of a detractor. It is this assumption that provides the basis for subtracting the percentage of detractors from the percentage of promoters.
Second, passives have no value to the organisation. The fact that the percentage of passives is explicitly excluded from the NPS calculation means exactly that.
But are these two assumptions true?
The answer is inadvertently supplied by Reichheld in the only worked case study in his 2006 book, concerning computer giant, Dell. At the time of the study, Dell had 8 million customers, 60% of whom were deemed promoters and 15% detractors. The average value of a customer was independently estimated to be $210.
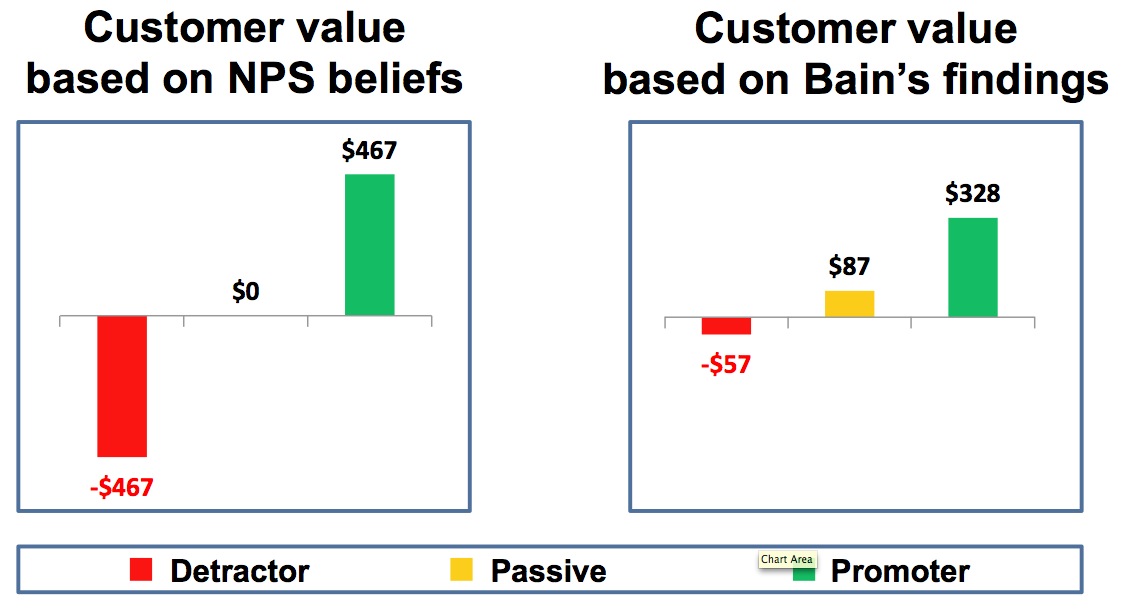
Based on these figures, and the two NPS assumptions, the average value of a promoter, passive, and detractor must be $467, zero, and -$467 respectively. These values are not given in his book – presumably he hadn’t thought to perform these calculations. Instead, with no hint of understanding the implications, Reichheld informed readers that, according to analysis undertaken by Bain and Company, the value of a promoter is $328, and the value of a detractor is -$57. That being the case, it follows that a passive customer has a value of $87.
The dollar values of promoters, passives and detractors according to NPS logic clearly bear no relation to Bain and Company’s findings. Even allowing for the fact that Reichheld admits that Bain and Company has probably underestimated the cost of a detractor, there is nothing to suggest that it is out by a factor of eight.
While the difference between -$57 and -$467 is small on a per-detractor basis, in aggregate, it amounts to close on half a billion dollars!
If we compare the benefit to Dell of converting a detractor into a passive customer with the benefit of converting a passive customer into promoter, then, according to NPS logic, they should be exactly the same, namely $467. However, Bain and Company’s analysis suggests that they are much smaller than this, and differ from one another by nearly $100 ($144 versus $241 respectively). Again, if we make these comparisons in aggregate, they can conservatively amount to tens of millions of dollars.
If Bain and Company’s analysis is accepted as being substantially correct, which is presumably the reason why Reichheld included it in his book, then the only conclusion that can be drawn is that management decisions based on NPS logic can have serious financial consequences for an organisation.
These structural weaknesses of the NPS have another ‘curiouser and curiouser’ feature – significant changes in customer responses to the advocacy question can shrink from view, and certain small differences magnified.
As an example, consider the two advocacy scenarios shown in this chart, showing two sets of responses to the advocacy question: “How likely is it that you would recommend this company to your friends and colleagues?”
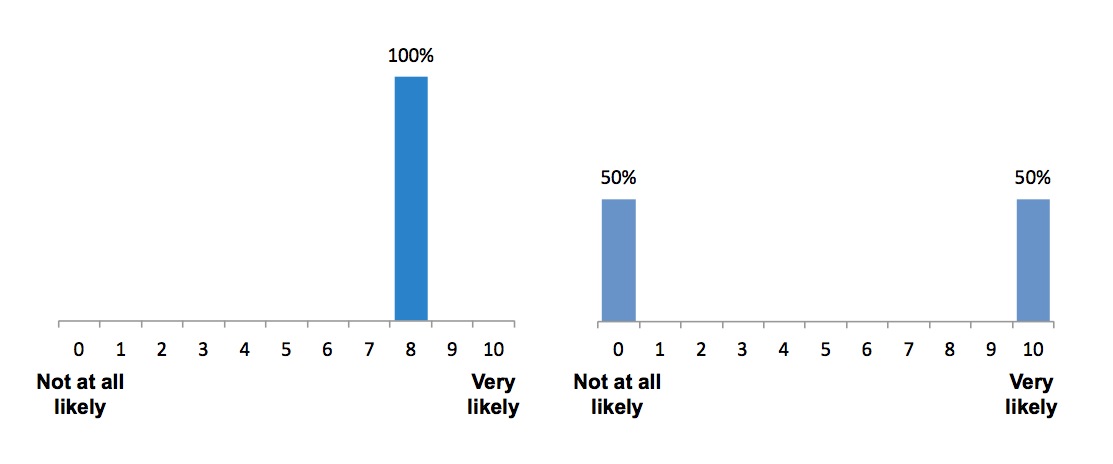
Our brains immediately register the difference – on the left, all customers give exactly the same response to the advocacy question, whereas we see two diametrically opposed groups of customers on the right. But through the NPS lens, we see no difference. Both have a score of zero, and that is all one needs to know. In other words, no detractors or promoters is regarded as being no different from having 50% detractors (at the extreme bottom of the scale) and 50% promoters. In comparison, the average advocacy score has no such difficulty in recognising that the scenario on the left is clearly preferable to the one on the right, registering an eight and five respectively, on the zero to 10 scale. The fact that the average provides an answer in line with our intuition is no doubt due to it being the balance point of the distribution of responses, in the same way that the centre of mass is the balance point of a physical object, thereby making it a natural metric.
On the flip side, the NPS is overly sensitive to two specific changes – between six and seven, and between eight and nine. For example, if 50% of customers give a six in one year, then a seven in the following year, then that alone would increase the NPS by 50 points. In contrast, the average would increase by half. Relative to their respective scales, the NPS lens magnifies this change by a factor of five.
Given these weaknesses, Reichheld’s strident claims that the NPS is “a reliable tool for assigning accountability and managing priorities” and “links directly to the economics of growth” ring hollow.
Consider organisational culture
Management of those organisations currently NPS driven should reflect on their commitment to NPS as a corporate metric.
A question that management should consider is the type of organisational culture that will be an enabler of customer advocacy. Is a McCarthyism approach, where customers are labelled as detractors, passives, and promoters, really supportive of this goal? And what purpose do these concepts serve?
Aside from the difficulties with operationalising their measurement, should the organisation be diverting attention away from the core idea of customer advocacy, which is a positive concept for both the organisation and its customers?
Replace NPS with average advocacy
Management should also reflect on the seriousness of the flaws inherent in the net promoter, and consider replacing NPS with the average advocacy, a much simpler metric, that does not distort the original data. This is not to say that management shouldn’t examine percentages at the top or bottom end of the scale, but as the average uses all the data without any adulteration, it provides management with a more accurate assessment of customer advocacy.
Consider how customer advocacy drives growth
The next consideration is the extent to which efforts to improve customer advocacy drive organisational growth. While it can be argued that an improvement in advocacy or, more correctly, an improvement in the intention to recommend a company, suggests increased loyalty among existing customers, it does not automatically follow that non-customers will switch from their current provider. In essence, customer advocacy is important for growth, but it only provides part of the answer.
A new approach that has recently been developed addresses this concern by linking the concept of customer attraction to customer advocacy.
Some brands have greater attraction than others, and people are motivated to choose the brand that they are most attracted to overall. In a mature market, this leads to winners and losers of market share, as competing brands battle for ascendancy. It would be expected that a customer’s attraction for the brand which they currently use would have a positive influence on their intention to recommend the brand.
However, when we consider the influence that their advocacy might have on competitors’ customers (which is essential for growth), it will be only one of a number of factors that determine the relative attraction for competing brands. For example, a customer’s attraction to a brand, with which they have an existing relationship, will depend on the total social influence received from consumer advocates (be it for or against a brand), as well as their own direct and indirect experiences with their current brand.
Ultimately, whether a customer stays with their current brand, or switches brands, will depend on how these factors resolve themselves, in terms of the relative attraction of the competing brands.
As a result, relative attraction is considered to be the driving force of the growth potential of competing organisations. Interestingly, relative attraction can be measured for both established brands and new ‘disruptive’ entrants, affording management with insights as to their growth potential, and the risks posed to established brands.