

2013 sees OOH revenues climb to $543m in year of record growth
Share
The Australian out-of-home (OOH) media industry experienced its biggest year of growth on record in 2013 posting a 7.1% overall increase on net revenue year-to-date, taking the industry’s net revenue to $543.8 million, up from $507.7* million in 2012.
After breaking through the $500 million revenue mark in 2012, the Outdoor Media Association released figures today which boast revenue increases in each quarter of 2013. Q1 saw the industry grow by 3%, Q2 recorded 5.2% growth, Q3 saw growth reach 8.6% and Q4 saw the strongest growth with 10.8% ($162.8 million net revenue in comparison to $146.9 million for the same quarter in 2012).
“We have seen fifteen out of sixteen quarters of growth since we recovered from the GFC in 2010. It is always uplifting to start a new year with such buoyant results, we are very optimistic about the market in 2014 because we know OOH is the most versatile broadcast channel in an increasingly fragmented market,” Charmaine Moldrich, CEO of the Outdoor Media Association, said in a statement to media.
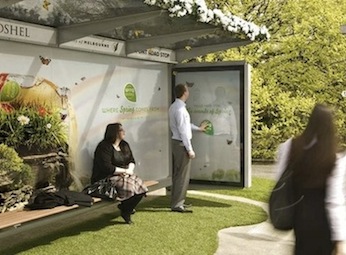
Digital out-of-home (DOOH) represents 11.3% of revenue, reflecting a 50% increase from 2012, when it accounted for 7.5% of revenue.
OOH audiences are also growing. In 2013, the industry’s audience measurement system MOVE (Measurement of Outdoor Visibility and Exposure) reported an increase of 9% in total daily contacts measured, totalling 385 million up from 355 million in 2012. People are travelling further each day and spending an average of 14 hours travelling and shopping each week. In light of this, Australians are likely to see an average of 25 advertising faces each day.
Category totals for 2013**
- Roadside billboards (over and under 25 square metres) $178.5 million
- Roadside other (street furniture, taxis, bus/tram externals, small format) $196.2 million
- Transport (including airports) $85.4 million
- Retail $83.6 million
Category figures for Q4 2013**
- Roadside billboards (over and under 25 square metres) $52.2 million
- Roadside other (street furniture, taxis, bus/tram externals, small format) $58.6 million
- Transport (including airports) $25 million
- Retail $27 million
* Figures have been adjusted from previously reported 2012/2013 revenue to reflect changes in OMA membership, allowing direct comparisons in revenue year on year.
** Figures may not add to total due to rounding.


