

Real stats from our latest mobile-enabled OOH campaigns
Share
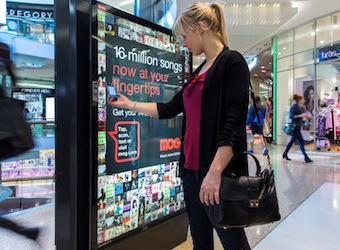
Mobile is a space where big numbers are regularly forecast and occasionally, big numbers are reported too. By definition, it’s a medium where handsets, models, volumes, usage and revenue numbers are all very substantial to date, but one exception has been getting real data on how people use their mobile phones to interact with things that interest them. At Eye, we’re obviously all about out-of-home, so my interest naturally lies here. A few months ago we launched Amplify by Eye, an out-of-home advertising mobile-enabled system where the advertisers can plug in their online campaign into their out-of-home one.
That was the top line objective and we did achieve it, but not without learning a few things on the way:
- It’s harder than it appears – logistically and technically it’s very difficult to build a technology-agnostic application and progressively roll it out across nearly 10,000 locations in four countries. The US, representing about 4000 locations, is the last to go but is well underway now,
- consumers are quick to make judgements about whether there is anything relevant and valuable in it for them,
- simple is good and complex is bad in terms of what consumers actually see and are asked to do, and
- consumers are curious – even when there is no call to action on the out-of-home ad, thousands of consumers have walked up to a sign and used their mobile device to see what happens.
Six months on from launch, some of our major clients have used it and now we have the chance to share some real data from it. For better or worse, here are the results from mobile-enabled out-of-home campaigns.
Total campaigns: 12
Total interactions: 7500
Type of interaction:
- NFC 25%
- QR 71%
- SMS 5%
QR codes are a clear leader, but NFC usage is disproportionately high compared to market penetration of NFC-enabled devices (which is closer to 10%). Does this mean that the early adopters who own NFC-enabled phones are more likely to notice and engage with mobile-enabled advertising? Almost certainly. But picking only one technology will by definition reduce your reach.
Note that it is still very early days with the US where SMS coupons and redemption figures are historically very high. Accordingly we expect to see a higher proportion of SMS usage in the US compared to Australia, NZ and the UK.
Device Type: iPhone still leads but Android devices are nearly on level terms:
- Blackberry 2%
- Android 40%
- iPad 1%
- Windows 9%
- iPhone 45%
- Mac 1%
- Other 2%
Early on, iPhones were well in front with more than 50% of all interactions, and now after only four months Android interactions are drawing closer and Windows phone interactions have also increased. So it’s fair to say that mobile interaction patterns broadly reflect device distribution.
Interestingly, at least to me, is the fact that iPads, iPods, Nintendo 3DS, Macbooks and Galaxy Tabs have all been used to interact with Amplify tags. While the numbers are low for some of these devices, it does show that it’s not just about handsets and that some consumers better understand their devices and how to use them than perhaps advertisers do.
What’s my recommendation from this data? Design campaigns that cater for all devices, remain firmly technology agnostic, give consumers choice in how they interact, make the offer clear, make the process simple and be prepared to keep experimenting and learning as you go.


