

Internet-capable TVs up but traditional sets still dominate households
Share
Internet-capable devices are at an all time high in Australian households but TV sets still remain the primary household screen, according to the latest multi-screen report.
The 2014 fourth quarter report by RegionalTAM, OzTAM and Nielsen examines the household take-up of screen technologies and interplay between them. OzTAM CEO Doug Peiffer said the report shows “how life stage impacts media use across devices”.
“Australians have a large appetite for good content and TV sets continue to be the main place audiences go to satisfy this need, supplemented by content viewed on digital technologies,” said Erica Boyd, Nielsen’s senior vice president of cross platform audience measurement.
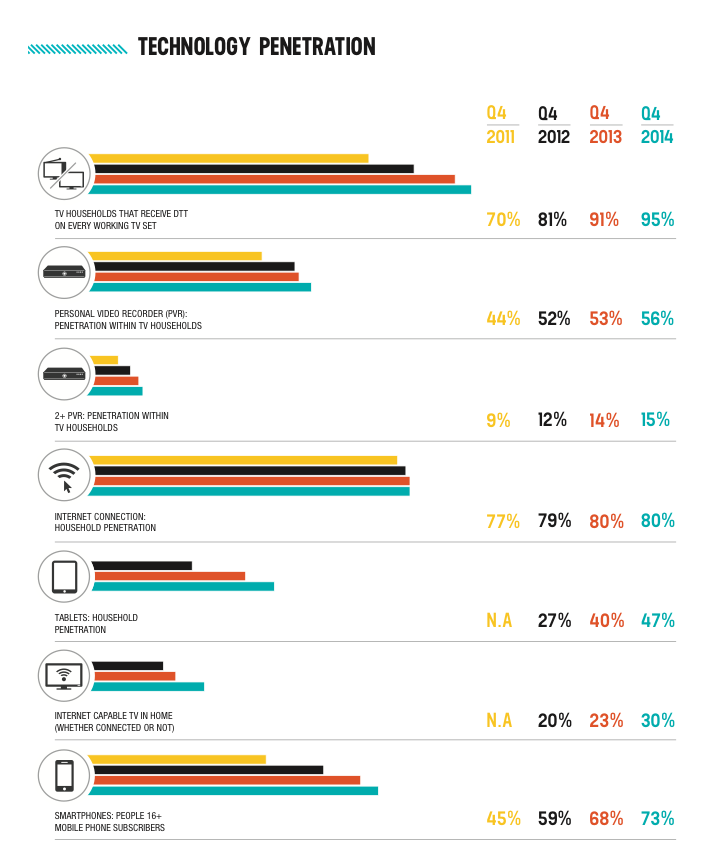
Technology in Australian homes
The report found household take-up of internet-capable devices reached a new high in Q4 2014. Australian are spending on average 37 hours and eight minutes per month online, compared to the previous year of 38 hours and 8 minutes.
The percentage of households able to access digital terrestrial television (DTT) has increased again to 95% this year. Take-up of personal video recorders, tablets and smartphones have all also increased in since Q4 2013. Internet-capable TVs have shown the fastest adoption rate this year.
TV viewing on various screens
Results found average viewing per day remained similar to previous years, with Australians spending an average three hours and six minutes watching broadcast television per day in 2014.
The majority of TV viewing is live, with less than 10% of audiences watching in playback mode.
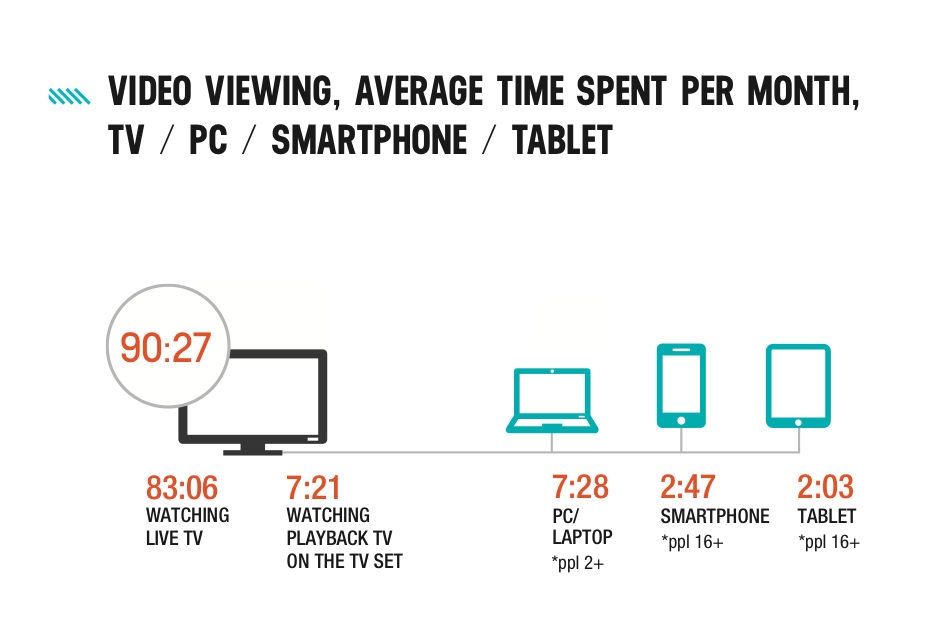
In Q4 2014, Australians watched an average 90 hours and 27 minutes of broadcast television each month, with 88% of all video viewing occurring on TV sets.
“People still turn to the main household TV first and will continue to do so. The death of TV will follow the death of the couch,” said Doug Peiffer.
Erica Boyd said consumer’s watching habits are still influenced by seasonality, tending to watch more TV in winter, as well as life stages.
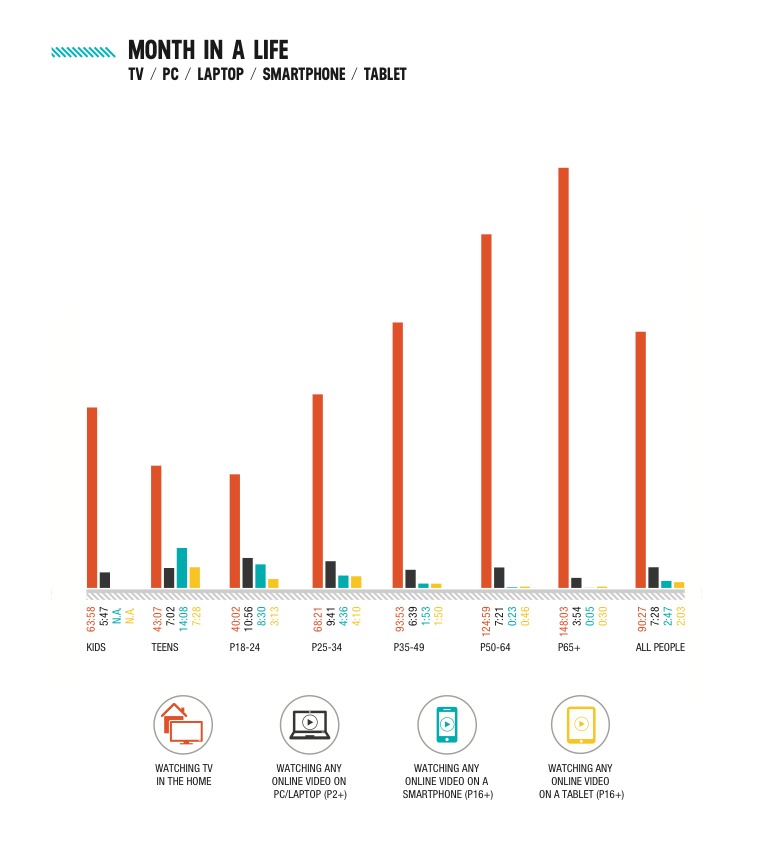
Television viewing declined across the overall population by an average of 31 seconds per day. The only age groups to increase TV viewing in 2014 were children 12 and under, and adults older than 50. Younger audiences are still watching more video content on mobile devices than older age groups.
“Teens always have been the lightest TV viewers, and as people get older and have children they stay home more and watch more TV. Now however Australians of all ages are viewing more on second screens, and their overall use of the TV screen is growing too,” said Doug Peiffer.
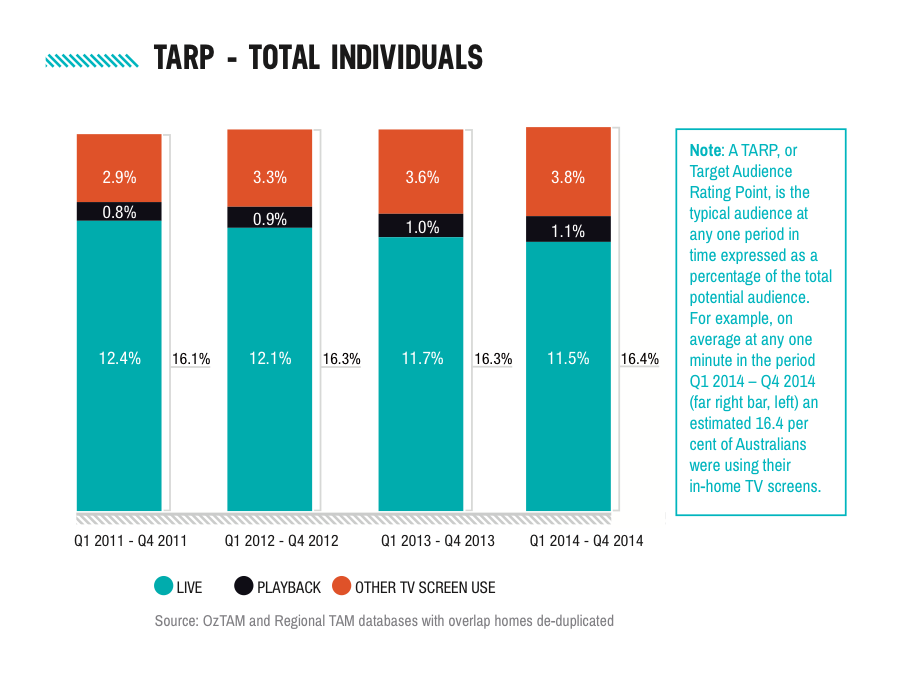
Total use of the television screen
In 2014, Australians’ use total use of TV sets averaged at 16.4% TARP (target audience rating point) across the whole day.
Broadcast TV viewing has remained stable each year, but live viewing has seen a slight decline over as more are using TV sets for other screen use such as gaming, network streaming services, internet browsing and watching DVDs.
This multi-screen report found about 13 million Australians spent an average of seven hours and 28 minutes per month watching some sort of video content on the Internet, up from almost six hours last year. The 18-24 age group spend almost 11 hours a month viewing videos online.
Regional TAM chair and NBN Television CEO Deborah Wright said:
“This issue of the Multi-Screen Report highlights the continuing dominance of television as the primary screen in the household, and regional viewers are in fact consuming more TV on average per month when compared to 2013.”