

Mobile marketing: Australia and New Zealand are excelling with tablets but lagging with smartphones
Share
Australian and New Zealand are leading the world in embracing tablet technology but lag behind most of Asia Pacific in using smartphones for mobile marketing.
This mixed message for digital mobile marketing emerges from Adobe Digital Index’s Best of the Best Benchmark 2015 which compares the overall ‘average’ verses the ‘best’ websites across eight Asia Pacific regions: Australia and New Zealand, Southeast Asia, India, South Korea, Hong Kong, China, Japan and the United States.
The index divides websites in each region into two cluster groups at the fourth quintile – the ‘best of the best’ (the top 20% performers) and ‘the rest’, or ‘average’ websites (the bottom 80%). The smartphone, tablet and total mobile marketing gap between these two clusters is then recorded according to six key performance measures:
- Traffic from smartphones and tablets,
- stick rate (the number of visits that last more than one page),
- visits-per-visitor,
- time spent,
- conversion rate, and
- click-through rate.
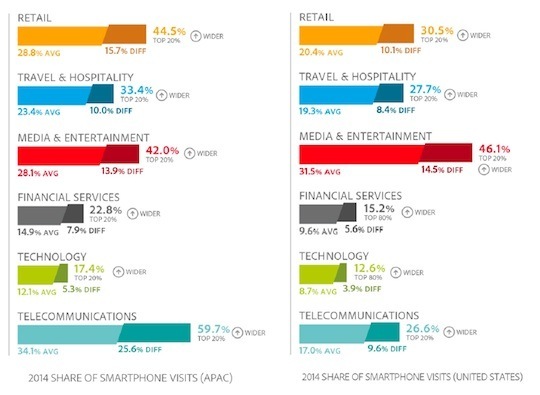
The Adobe Digital Index research also includes statistical breakdowns for both and total mobile penetration rates for key industry categories: retail, travel and hospitality, media and entertainment, financial services, technology, and communications.
Click images to enlarge.
Not surprisingly telecom companies lead all industries for total mobile (smartphone and tablet) usage, with a huge gap between the ‘best’ and ‘the rest’. 60% of visits to the best telecoms websites come from smartphones and tablets, and just a still significant 30% for average websites. Other heavy adopters include retail (‘best’ 45%, ‘average’ 29%), media and entertainment (‘best’ 42%, ‘average’ 28%), travel and hospitality (‘best’ 33%, ‘average’ 23%) and financial services (‘best’ 23%, ‘average’ 15%).
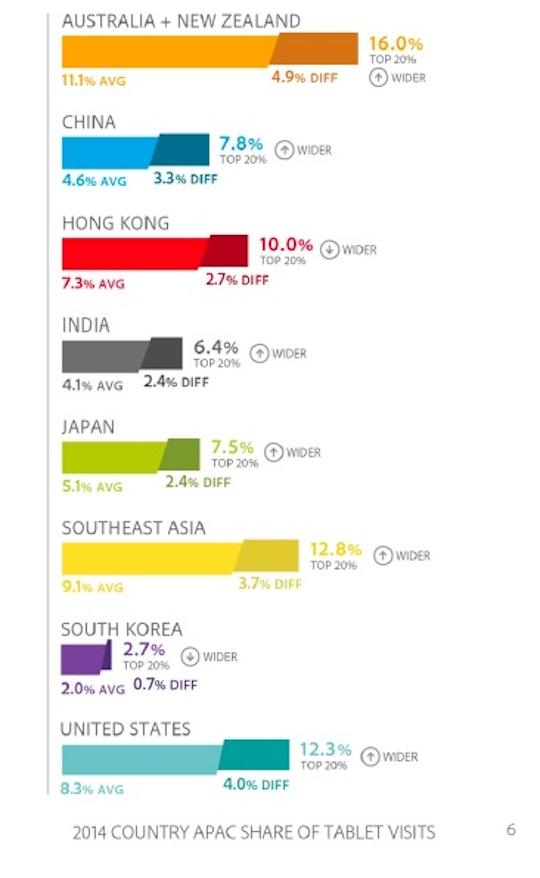
The regional comparisons showed that Australia and New Zealand recorded the highest share of traffic from tablets, at 16% for the best websites and 11% for average websites. Comparable figures for best and average websites in Asia were 8% and 5% respectively, driven down by low adoption rates in South Korea (‘best’ 2.7%), India (‘best’ 6.4%) and Japan (‘best’ 7.5%).
The data underscores how more advanced Australian and New Zealand consumers and businesses are in embracing tablet technology and how significant the gap is between the best, mobile optimized websites, and ‘the rest’, especially in the above leading industries. The study also notes that, currently, tablet visitors tend to consume more video and rich content, using it as a fixed mobile device and accessing through wi-fi most of the time.
Australia and New Zealand’s strong rate of tablet adoption means that combined mobile usage (smartphones plus tablets) is healthy, with 45% of visits to ‘best’ quintile websites coming from smartphones or tablets, and a still respectable 32% for ‘average’ websites.
 Australia and New Zealand therefore compare well overall for mobile marketing adoption with leading regions such as Japan (‘best’ 63%, ‘average’ 41%), South Korea (‘best’, 62%, ‘average’ 37%), SouthEast Asia (‘best’ 49%, ‘average’ 35%) the United States (‘best’ 42%, ‘average’ 27.5%) and Hong Kong (‘best’ 43% ‘average’ 38%).
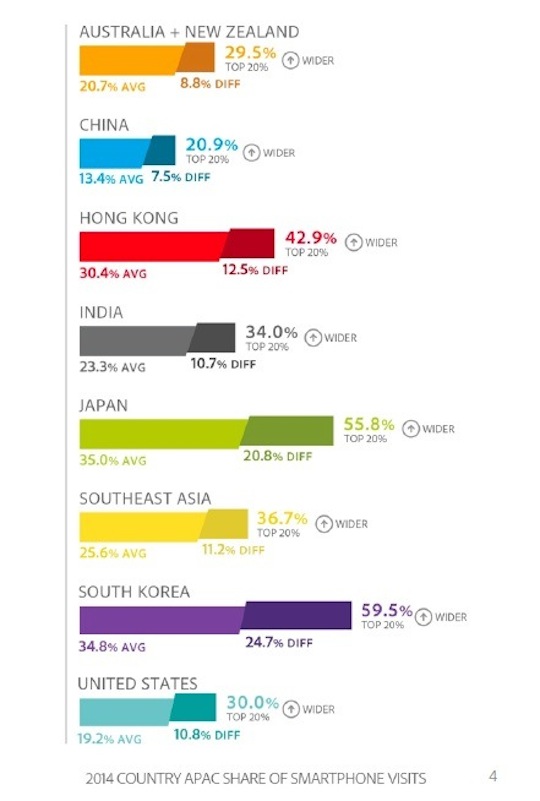
For Australia strongest tablet usage is correlated with relatively weak smartphone usage – suggesting a preference for the larger tablet screens. Meanwhile, the strongest smartphone adoption in South Korea and Japan is correlated with the weakest adoption of tablets – suggesting faster and stronger acceptance of relatively smaller smartphone screens. Notably, only Australia and New Zealand experienced growth in tablet usage (up 2%) for 2015.
Further findings for Australia and New Zealand include:
- Time spent by mobile consumers is 29% higher for Australian websites in the ‘best’ category compared to average websites,
- acquisition by search is strongest in Australia and New Zealand, with click-through-rates of 6.5% for the best sites compared to 3.5% for the average websites,
- Australia and New Zealand are now equal highest with Japan on conversion from mobile platforms (‘best’ 5%, ‘average’ 3%) and ahead of third placed United States (‘best’ 4.4%, ‘average’ 2.5%)which is significant since conversions relate directly to revenue, especially for retail and travel and hospitality industries, and
- Australia and New Zealand lead the entire region in loyal return visitors, both from best of the best and the average websites, which equates to higher loyalty and reduced acquisition costs
Mobile marketing implications for Australia and New Zealand
According to Tamara Gaffney, director of Adobe Digital Index, the best digital marketers in Australia and New Zealand are strong performers in all six key performance areas, especially in areas like conversion rates and mobile (combined smartphone and tablet) visits.
“Not only did we see the gaps increase for tablet and smartphone visits between the best of the best websites and the average websites, we congruently saw the ‘best of the best’ are also moving away from the average in terms of conversion, stick rates and visits, indicating the direct correlation between mobile capability and consumer engagement.”
With nearly half of all website visits within the ‘best’ quintile coming from smartphone and tablet visits Gaffney says that mobile optimisation is no longer an option, and if businesses are under-skilled in mobile development they are at a severe disadvantage.
“The data is telling us that delivering seamless experiences across devices is the key to acquisition and engagement,” she said.


